How to Monitor Your Business in Practice? – Part 2
In this second part, we discuss the case of annual and paid subscriptions.
- How annual subscribers complicate monitoring
- Reconciling the acquisition and retention of annual subscriptions
- Monitoring the number of annual subscribers
It is necessary to have read the first part of the article before continuing.
1. Monitoring Acquisition
There’s no difference in monitoring between acquiring monthly and annual subscriptions. We will reuse the same table.
2. Monitoring Retention
There are two major differences between monthly and annual subscriptions that affect the way to monitor.
- The first is technical. It’s related to the time available to charge the renewal fee. This is the billing window 💰.
- The second is a time constraint ⏰ related to the length of the subscription. We can’t wait a year to know how the retention rate evolves.
a. The billing window
Monthly subscription renewals must be done in a few days. For annual subscriptions, we can schedule multiple billing attempts over several days if the first attempt fails. Therefore, the billing window for annual subscriptions can be longer.
Practically, if the billing window is 10 days, then a subscription expiring on May 1st will be charged between April 21st and May 1st. So, April renewals come from April or May expirations 🤓.
Consequently, we cannot use, for monitoring purposes, a retention rate that would be calculated as: (number of renewals sold this month) / (number of expirations this month).
Indeed, when expirations vary significantly month to month, the calculated retention rate can exceed 100%. 🤯.
🤔 Not convinced?
Let’s take the following case: every month, 10,000 subscriptions expire. Suddenly, there’s a peak of expirations at 20,000 during month #3. The actual retention rate is 80%. The billing window being 10 days, one third of the subscriptions retained during month n expire during month n+1 and 2 thirds expire during month n.
Let’s observe the number of subscribers retained each month and compare it to the number of expirations in the same month.

Table #1 : example of aberrations in month #2 as Retained > Expiring
Units retained during month #2 are composed of subscriptions expiring between the 11th of month #2 and the 10th of month #3.
During month #2, 10,667 subscribers are renewed while only 10,000 expire. The retention rate seems to be 106.7% 😮.
☝️The disconnect between transaction date and expiration date creates the difficulty of monitoring annual subscriptions.☝️
b. The time constraint ⏱️
A retention rate is calculated over a period equal to the length of the subscriptions. But we cannot wait one year to know the retention rate. We must get intermediate results.
A solution consists in monitoring the number of subscriptions that expire each month and the number of subscriptions renewed in the same month. This is not a retention rate but rather a conversion rate. Indeed, this ratio is the number of sold renewals compared to the opportunity.
🙄 Not convinced?
Let’s take the figures from the previous case. The actual monthly opportunity is calculated based on the billing window. Since the window is 10 days long, the opportunity for month #2 is made up of subscriptions expiring between the 10th of month #2 and the 10th of month #3.
In practical terms, this involves offsetting the number of expirations equal to the billing window. Thus, the opportunity for the month matches what can be charged during the same month.
Example of a monitoring table:
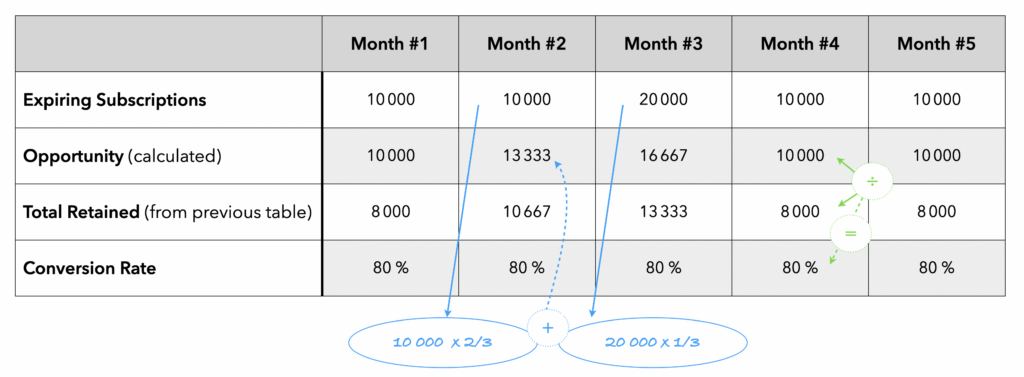
Table #2 : from Expirations to Renewal Opportunity and Conversion rate calculation
The opportunity for month #2 is made up of 2/3 of the 10,000 subscribers for month #2 and 1/3 of the 20,000 subscribers for month #3, i.e. 13,333 subscribers.
☝️ The conversion rate, calculated from the opportunity, is a proxy for the retention rate. ☝️
Depending on the variations in number of subscriptions during the month, this rate will be more or less equal to the retention rate. In the example above, the conversion rate is perfectly equal to the retention rate. In real life, it will be slightly different each month but equal over a cumulative year.
3. Reconciliation
Reconciliation is difficult because expiration and transaction dates don’t always match.
It’s better to consider reconciliation based only on sales to date: booking, units sold and ASP, with possible segmentations and month over month comparisons and the same month in previous years.
In some cases, the reconciliation of Acquisition and Retention is not relevant, for example:
- When the retention rate is high, the size of the acquisition business is small compared to the retention business. Reconciliation risks diluting the acquisition performance.
- When the business is mature, the objective of Acquisition is generally focused on the number of subscribers when retention objective is on booking.
Finally, to monitor the number of subscribers, it’s necessary to use only the expiration dates with a regular split (monthly for example). At the end of each month, we report: the number of subscriptions that expired, the number of subscriptions renewed and the number of subscriptions newly acquired. We perform a rolling sum over 12 months which gives us an annualized view each month.
Example of a monitoring table (with fictitious figures):
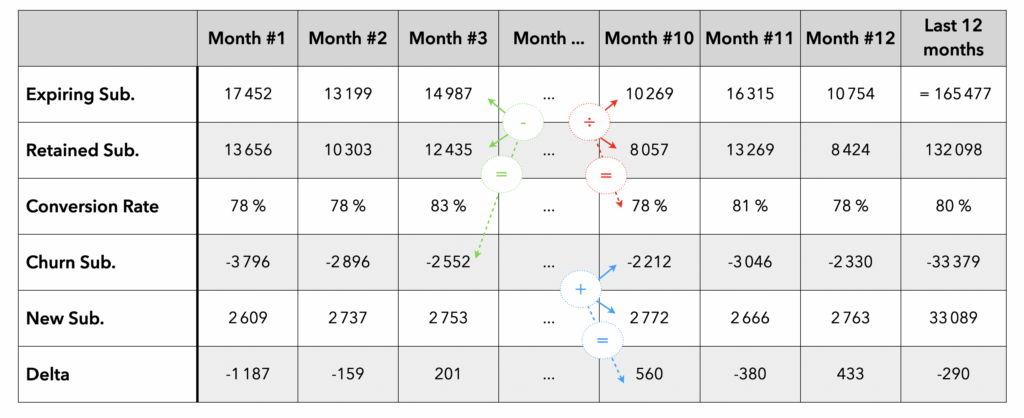
Table #3 : table to monitor the number of subscribers a sliding 12-month period
In this example, we have a rolling 12-month retention rate of 79.8%, a churn of -33k subscribers offset by +33k new subscribers. However, we have a negative subscriber balance over one year of -290.
In the next and final part of this article, we’ll cover monitoring cross-sell sales.

What are Macro KPIs and Micro KPIs?

What is Tenure and why is it important?