Individual improvements but global deterioration. How is it possible?
Summary
It is normal. It is totally possible to have increasing retention rates locally and a decreasing retention rate globally. This is an illustration of Simpson’s paradox, named after the mathematician Edward Simpson.
I monitor my Acquisition business on a daily basis by checking KPIs such as traffic and conversion rate in the different segments, audiences, etc.
And of course, I monitor my Retention business by checking KPIs such as the retention rate (RR%).
1. Business monitoring
I monitor the subscriptions that are due to renewal every month. These are my Expirations. The monthly Retention Rate (RR%) is defined as the number of Expirations retained over the total number of expirations, this month.

Table #1 : global view.
RR% = Retained / Expirations
For my monitoring needs, I do month over month comparisons to know how my business trends.
2. Monitoring in detail
I want to know my business in detail, be able to anticipate any change in trends. So, I look at my KPIs at a lower level. I segment by source of acquisition, by product, by country, by previous renewal price, by you-name-it …

Table #2 : same view segmented by Product (A and B).
In table #2 above, we have a split by product. Product A and B retain respectively at 75% and 25% and the overall RR% is 65%.
Overall RR% = Sum of Retained / Sum of Expirations.
3. Local Improvements but Global Deterioration.
I keep on comparing, month over month, the RR% of each segment. When I look at the individual RR%, each of them increase ⬆️. However, the overall RR% is decreasing ⬇️.
How is it possible ?🤯
This is the Simpson’s paradox. It’s a statistical paradox in which a phenomenon observed in several groups is reversed when the groups are combined.
Still not convinced? Wanna see some numbers?
I sell subscriptions for a video streaming service📽️. I propose :
- An advertising-free service (Product A)🎬🍿 very appreciated which constitutes most my product mix.
- An entry-level service (Product B) 🎬 which attracts a few curious people and retention is low
This month (table #3), I had the same number of subscriptions to renew but the product mix varies compared to last month (Table #2).

Table #3 : Same total number of expirations as in table #2.
The product mix changed slightly toward Product B. Compared to table #2, each product RR% is increasing📈.
The RR% of Product A goes from 75% to 77%: +2 point 👍
The RR% of Product B increases from 25% to 27%: + 2 points👍
The overall RR% goes from 65% to 64%: -1 point. 👎
4. Equally confusing: the opposite is true.
The following month, I have still the same number of subscriptions to renew with a product mix in favor of Product A.
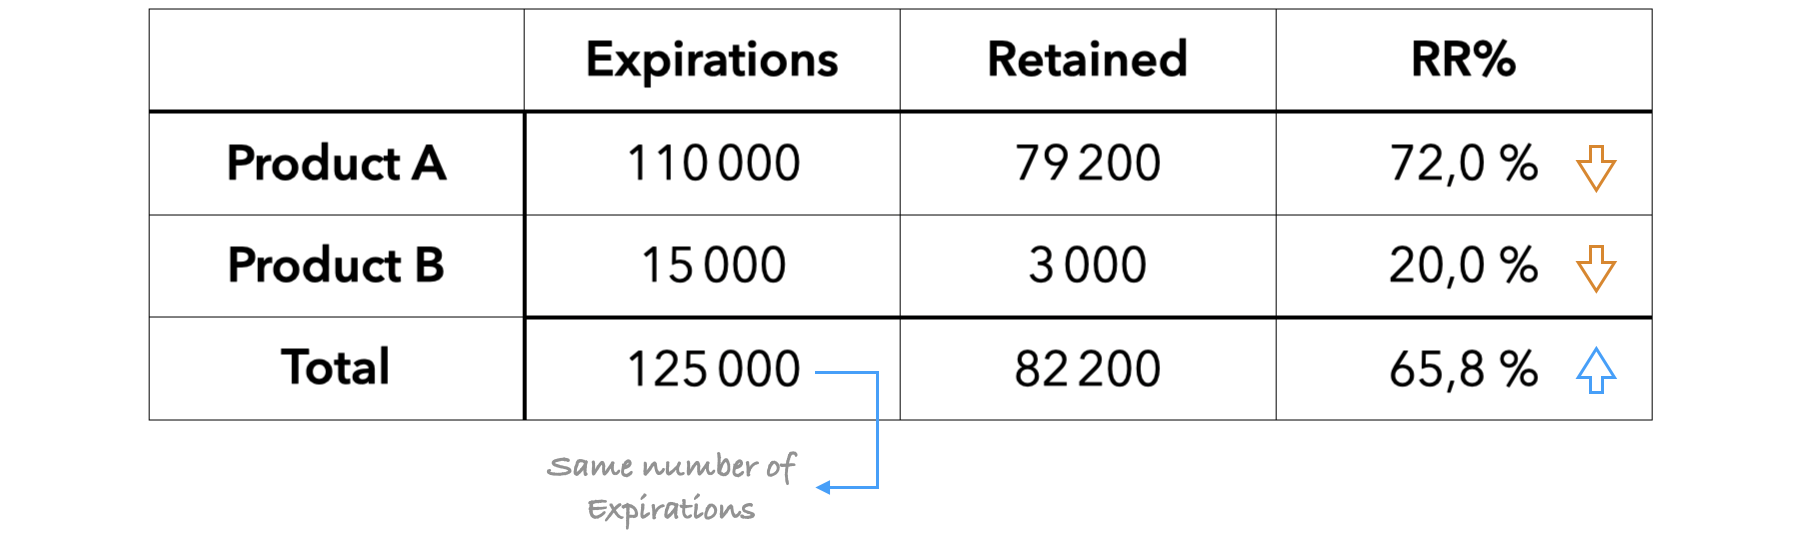
Table #4 : Same total number of expirations as in table #2 and #3.
In table #4, the individual RR% decrease significantly 📉compared to table #2 & #3. However, the overall RR% is up 📈.
The RR% of product A goes from 77% to 72%: -5 points 👎
The RR% of product B goes from 27% to 20%. : -7 points 👎
The overall RR% goes from 65% to 64%: +1.8 points. 👍
5. What is this mathematical mystery?
This is the principle of weighted average. The average RR% isn’t equal to the average of the percentages. In the calculation of the RR%, the weight of expirations is much greater than the weight of the RR%.
Intuitively, we want to believe that an improvement in each RR% will generate an overall improvement in the RR%. This is only true if only one parameter in the equation changes.
Key Takeaways
- There’s an 11th commandment:☝️ “You shall not average percentages”.
- Telescope 🔭 and microscope 🔬: It’s crucial to monitor your business by having a global view and a detailed view. One doesn’t go without the other.
- The Simpson paradox reminds us that it is as easy to make mistake as to manipulate minds by presenting only part of the numbers.
The Simpson paradox on wikipedia

How to Monitor Your Business in Practice? – Part 3

How to Monitor Your Business in Practice? – Part 1