Manual Renewal KPIs – Part 1
In my previous article, I detailed the use cases that make a manual renewal process useful, as well as the solutions implemented.
One solution involves having the customer purchase a subscription through a purchasing experience identical to the Acquisition flow.
In this context of online purchasing combining renewal and acquisition, what KPIs should be measured? 🤔
1. The Retention and Acquisition KPIs 📊
For Retention, we are primarily interested in the Retention Rate (RR%), calculated using the formula: RR% = (number of renewed subscriptions) / (total number of subscriptions to be renewed).
For Acquisition, we are primarily interested in the Conversion Rate (CR%), calculated using the formula: CR% = (number of subscriptions sold) / (number of visitors).
In both cases, we look at the number of transactions relative to the opportunity. 🔍
2. The Manual Renewal KPIs 🖥️
Unlike automatic renewals, manual renewals generate web traffic. 🌐 The opportunity for manual renewal is twofold:
- The number of subscribers eligible for manual renewal
- The number of visitors entering the manual renewal flow.
For the same number of transactions, we can calculate:
- ✅ a Retention Rate (RR%)
- ✅ and a Conversion Rate (CR%)
3. The Interesting Cases 💡
a. The Visit Rate
Let’s imagine a situation where every subscriber eligible for manual renewal visits the renewal flow. 70% of them purchase. 🛒

Table #1 : traffic view and retention view, with Visite Rate 1:1
I define the Visit Rate as the average number of visits generated by eligible subscribers.
📌 In this first case, each subscriber generated a visit; the Visit Rate is 1:1. CR% and RR% are equal. ⚖️
b. Variation in Visit Rate, but RR% Constant
Let’s imagine we set up new manual renewal notifications. 🛎️ Subscribers click much more and visit more; The visit rate increases to 2:1. Each subscriber enters the renewal flow twice on average, but the number of transactions remains unchanged.
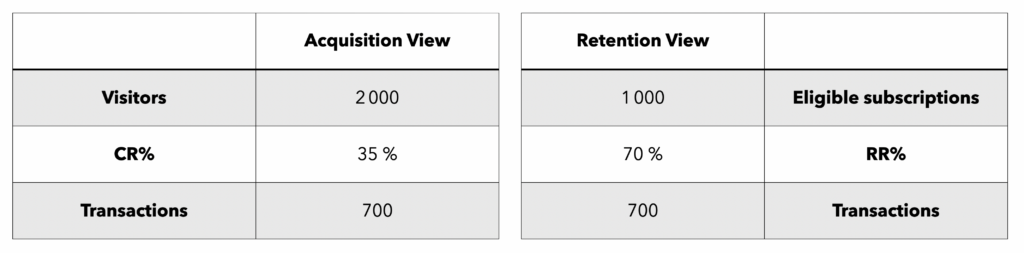
Table #2 : traffic view and retention view, with Visite Rate 2:1
🔄 In this case, for the same number of transactions, the RR% is double the CR%.
📊 As we can see, a change in CR% does not necessarily imply a change in RR%.
c. Joint Improvements
Let’s imagine we have now a more aggressive renewal offer. 💥 Traffic remains unchanged since subscribers are not aware of the offer before their visit. This time, the conversion rate increases.📈
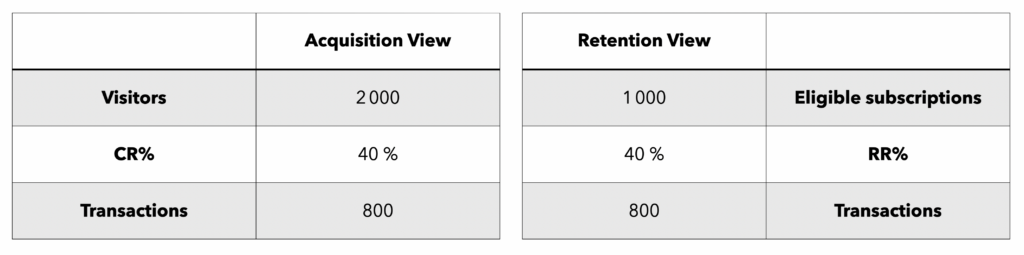
Table #3 : Visite Rate steady at 2:1 and CR% increases
With a constant visit rate, an improvement in CR% automatically leads to an improvement in RR%.
4. The Interest of Monitoring both CR% and RR%
The visit rate is not a actionable KPI that deserve a close monitoring. ❌ But it’s interesting to understand the existence of this relationship between CR% and RR%.
By nature, visitors to a manual renewal flow will constitute rather “qualified” traffic. ✅ Indeed, these are subscribers whose automatic renewal failed and who decide to respond to a communication from the merchant. They have the opportunity to
- cancel their subscription effortlessly 🙅
- or switch to a competitor. 🚶♂️
But they decide to consider an offer to stay.🙋♀️
a. Understanding the Levers
Assuming we have our baseline reference. 📏 By observing the variations in CR% and RR%, we can assess the effects of the tested changes:
- 📉 CR% down, RR% flat: we generated more unqualified traffic.
- 📈 CR% up, RR% down: the traffic dropped and was concentrated on the most qualified subscribers.
- 🌟 CR% and RR% up: we have a better renewal offer.
- 🚫 CR% and RR% down: traffic became less qualified.
b. Different Causes, Same Consequences, and Opposite Interests
This last case is interesting because it illustrates the importance of knowing how to take into account the recent site changes in the analysis. 🛠️ Based on the nature of recent projects, we could say:
Bad news: 📉 the new notification campaign isn’t targeting the right subscribers. We’ve lost qualified subscribers to less qualified ones. This results in lower conversions and lower retention. (CR% and RR% are down).
Good news: 📈 the payment profile update campaign worked. We managed to automatically renew the most qualified subscribers. The remaining, less qualified, subscribers continue to visit the manual renewal flow. This results in lower conversions and lower retention. (CR% and RR% are down).
👉 Key takeaways 👈
- The visit rate allows us to establish the link between CR% and RR%.
- A change in CR% does not allow us to conclude on a similar change in RR%.
- The manual renewal flow is composed of subscribers with very different qualification levels. Depending on the segment observed or targeted, the results will vary greatly.

What are Macro KPIs and Micro KPIs?

What is Tenure and why is it important?
